WHO Dataset
Monday, March 16th, 2015WHO Data Set
We compiled a set of social, economic, health, and political indicators using data from the World Health Organization and partner organizations. The dataset is available in the following comma-separated values (CSV) file: http://www.exploredata.net/Downloads/WHO-Data-Set
Referecia de Processing para usar archivos CSV: https://processing.org/reference/Table.html
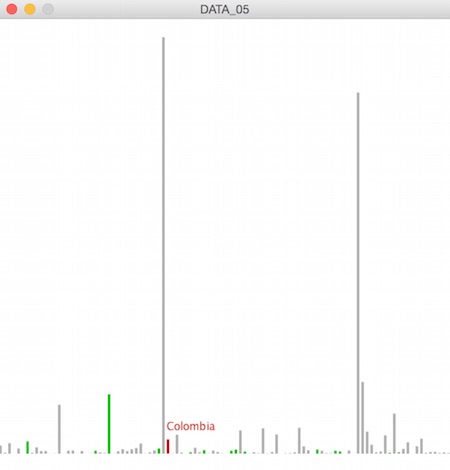
Table table; // tabla para cargar todos los datos del dataset
float porcentajesPoblacion[]; // arreglo que almacenará el procentaje de cada país de la población mundial
float totalPoblacion = 0; // variable usada para calcular la población mundial
int xr[], yr[], wr[], hr[]; // posición x, y, ancho y alto de las barras de cada país para detección del mouse

void setup() {
  size(500, 500);
  table = loadTable("WHO.csv", "header"); // carga el archiv CSV
  println(table.getRowCount() + " total rows in table");  // imprime tl total de filas (países)
  porcentajesPoblacion = new float[table.getRowCount()+1]; // crea arreglo para almacenar porcentajes
  xr = new int[table.getRowCount()+1]; // crea arreglo para almacenar x de la barra
  yr = new int[table.getRowCount()+1]; // crea arreglo para almacenar y de la barra
  wr = new int[table.getRowCount()+1]; // crea arreglo para almacenar ancho w de la barra
  hr = new int[table.getRowCount()+1]; // crea arreglo para almacenar altura h de la barra

  // calcula el total de la población sumando fila por fila en totalPoblacion
  for (TableRow row : table.rows ()) {
    totalPoblacion = totalPoblacion + row.getInt("Population (in thousands) total");;
  }
  println(" el total de la poblacion mundial es: "+totalPoblacion);

  // calcula los porcentajes de población correspondientes a cada país y los guarda en el arreglo
  for(TableRow row : table.rows ()) {
    porcentajesPoblacion[row.getInt("CountryID")] = row.getInt("Population (in thousands) total")/totalPoblacion*100;
  }

  // calcula y guarda las posiciones x, y, w, h para cada barra
  int x = 0;
  for (TableRow row : table.rows ()) {
    int gentecita = row.getInt("Population (in thousands) total");
    float genteEscala = map(gentecita, 0, 1328474, 0, 460);
    int paisID = row.getInt("CountryID");
    xr[paisID] = x;
    yr[paisID] = (int)((height-20)-genteEscala);
    wr[paisID] = 3;
    hr[paisID] = (int)genteEscala;
    x = x + 5;
  }

}

void draw() {
  background(255);

  int x = 0;
  for (TableRow row : table.rows ()) {
    // para cada fila extrae la población y el continente
    int gentecita = row.getInt("Population (in thousands) total");
    int continente = row.getInt("Continent");
    // escala el valor de la población para que quepa en la pantalla
    float genteEscala = map(gentecita, 0, 1328474, 0, 460);
    // si el continente es el 5 seleccione el color verde para la barra
    if (continente == 5) {
      fill(30, 200, 20);
    } else {
      // si no, seleccione un gris
      fill(180);
    }
    int paisID = row.getInt("CountryID");
    // if comentado para ver si el mouse esta dentro de la barra
    //if(mouseX>=xr[paisID] && mouseX<=xr[paisID]+wr[paisID] && mouseY>=yr[paisID] && mouseY<=yr[paisID]+hr[paisID]) {
    // si la X del mouse está sobre la barra del país seleccionado
    if(mouseX>=xr[paisID] && mouseX<=xr[paisID]+wr[paisID]) {
      // use el color rojo
      fill(200, 30, 20);
      // pinte el nombre del país seleccionado
      text(row.getString("Country"),xr[paisID],yr[paisID]-10);
    }

    // pinte la barra para el país de esta fila
    noStroke();
    rect(x, (height-20)-genteEscala, 3, genteEscala);
    x = x + 5;
  }
}
Descargar Folder con el ejemplo de clase: DATA_05
Variación cargando partes del data set en arreglos: DATA_03