FINAL PROYECT
Tuesday, February 3rd, 2015LEGAL DEFENSE AGENCY NATIONAL STATE
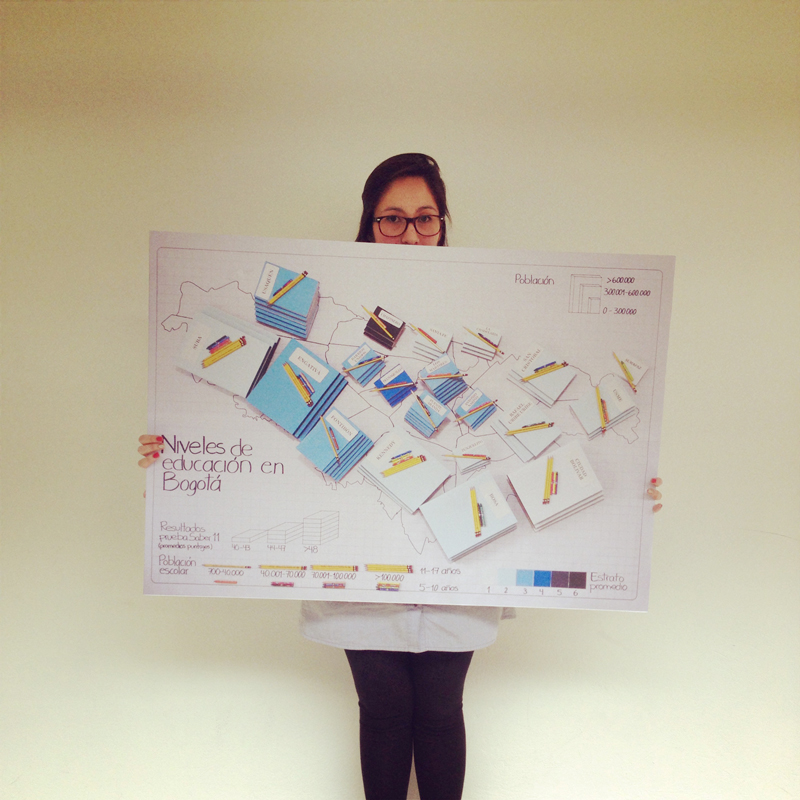
task . The National Agency for Legal Defence of State made in 2013 an inventory of the lawyers defending the state against the demands entities receiving national order. This inventory contains the following information for 2926 lawyers: education, experience, salary, entities in which they work, among others. This information is crucial to assessing defense policies of national level institutions and propose adjustments to the procedures of defense. The National Agency for Legal Defence of State has made empirical analysis of the collected information and is planning a strategy to disseminate the main results. The task we have to make students Study 6: Information Design is to understand the information collected and structure a series of different variables inforgrafías with inventory, serve as graphic support in the dissemination strategy of the main results.
deliverable . Infographics in digital format (.ai / .pdf) and printed in tabloid mounted on a rigid surface Project presentation in digital format (.pdf)
Free format printed Process Manual
……………..……………………………………………………………………………..
Group: Luisa Bojaca, Sebastian Barragán, Leonardo Molina, Juan Diego Prieto
……………..……………………………………………………………………………....
………………………………………………………………………………………………..
National Administrative Department of Statistics, DANE
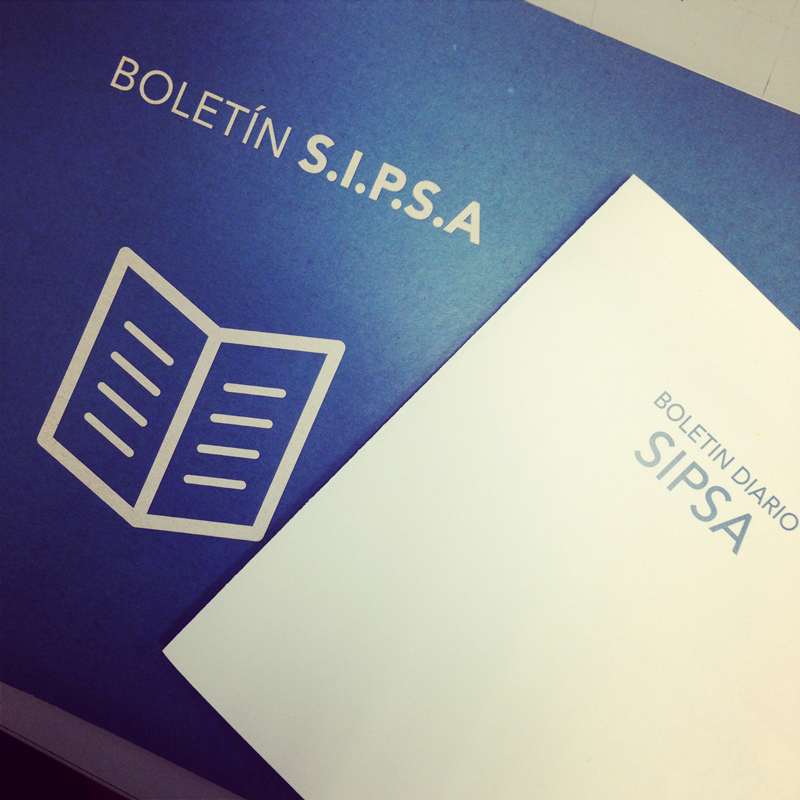
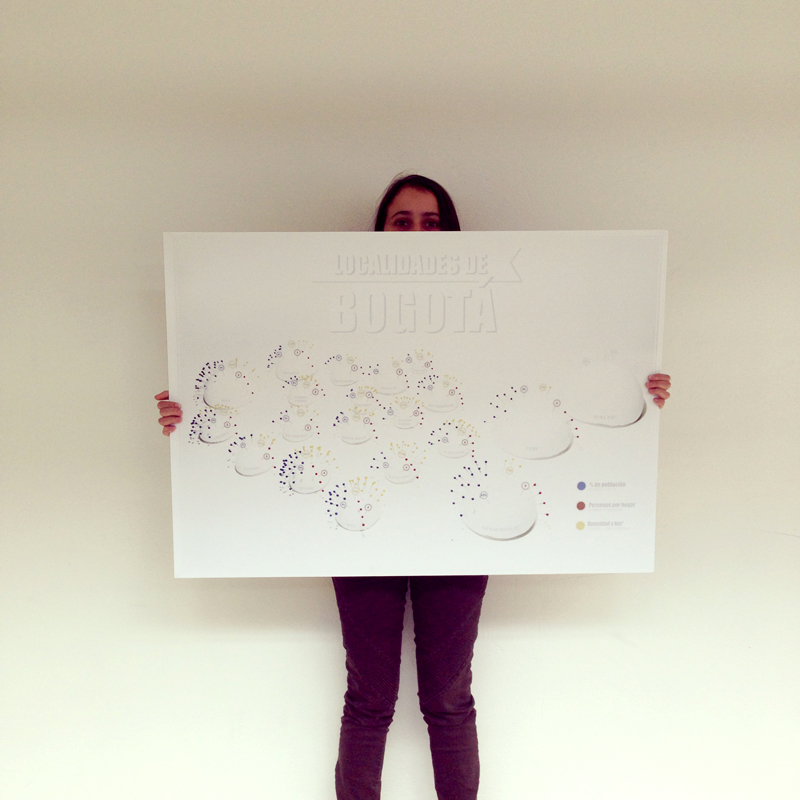
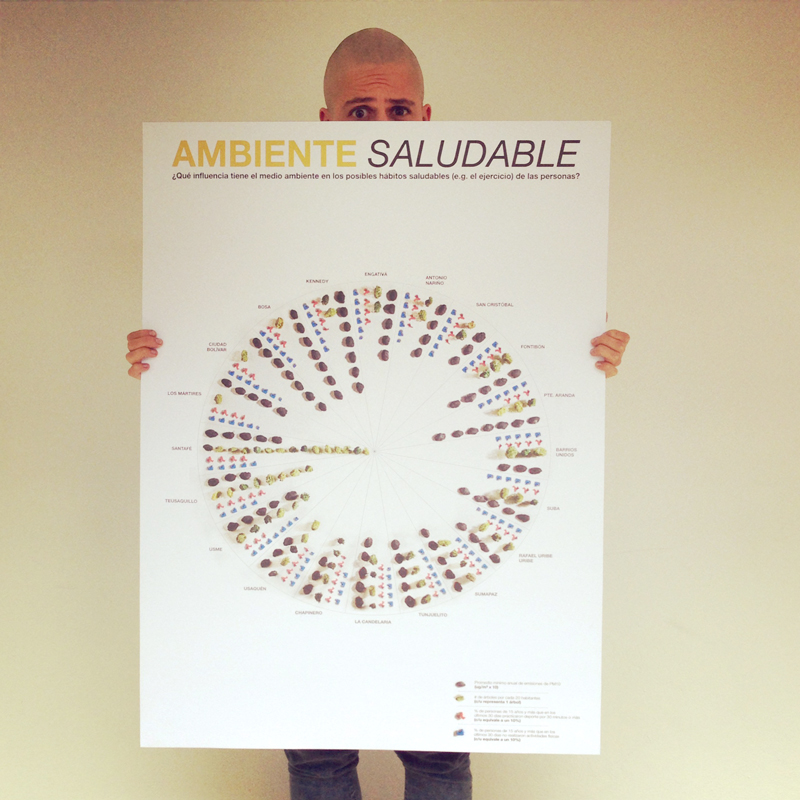
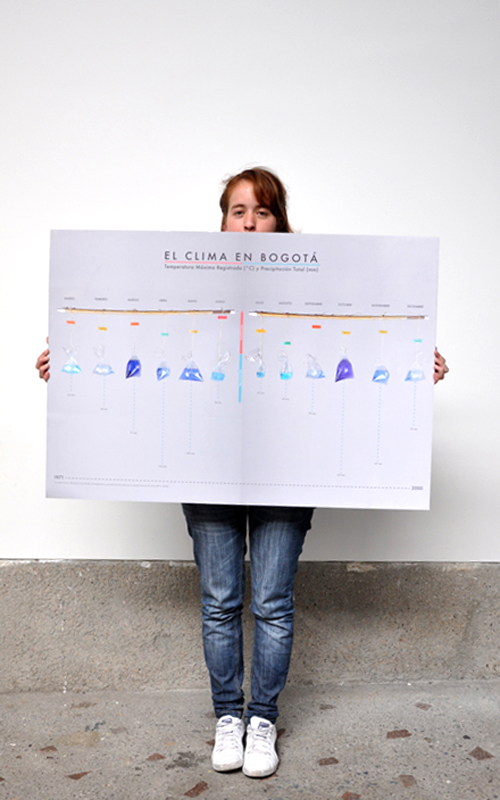
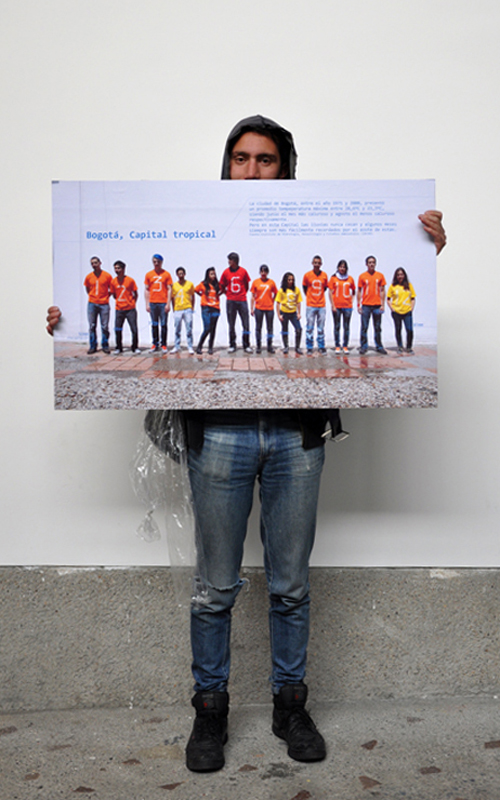
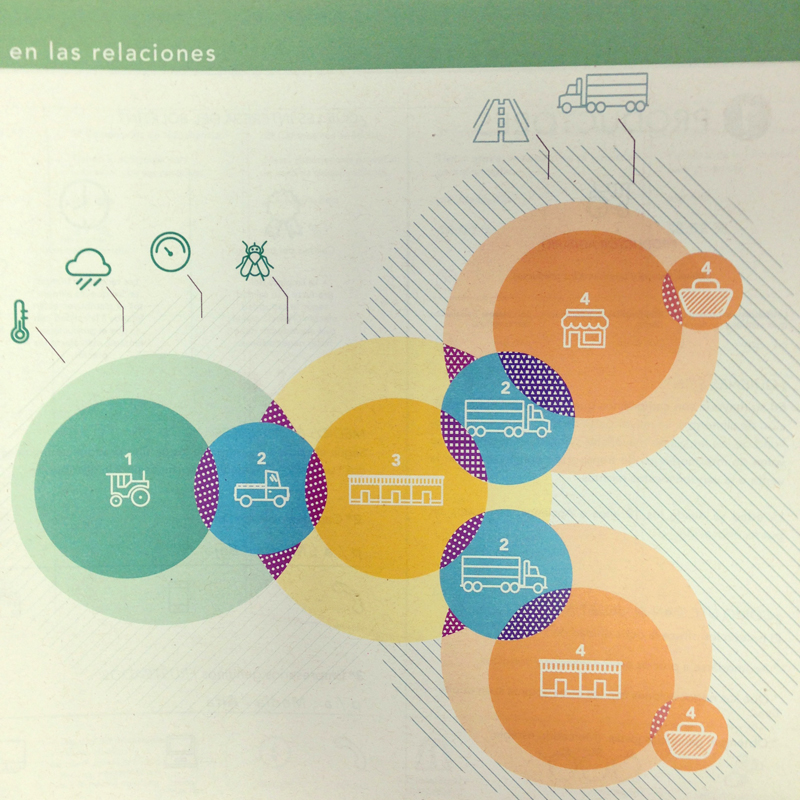
Daily Price Information System Supply the Agricultural Sector (an investigation of the National Administrative Department of Statistics, DANE) raises price information of more than 400 products of agriculture in 62 wholesale markets in the country. This information is distributed through different channels to different audiences and in different periodicities. The Supply Center Bogota, Corabastos, is one of these wholesale markets, which rises daily, consolidates and pricing information is distributed. These daily reports end up in the hands of the same vendors typically provide information and often claim to be a useful tool, but the question of whether it is a response that seeks gratification is DANE. However, its shape distribution, its scope is limited to vendors and among them, only a handful. In addition, information has a lag of hours.
Task . Given the formats currently used (see appendix), redesigning the distribution format of Sipsa local daily information and such that:
1. the volume of information produced by this research are exploited.
2. the audience as much as possible, beyond the wholesale markets, to reach new audiences or other places that may seize is maximized.
3. relevance to decision making by users is maximized. 4. Become so timely and immediate as possible.
5. Expand the knowledge of the brand DANE.
There are no limitations on the type of substrate should have this new form of distribution. The format can be printed, audio, audiovisual, visual, digital, analog, etc. provided that these five conditions are met.
……………..……………………………………………………………………………..
Group: Laura Abril, Mateo Anzola, Camila Foraro, Jimena Madero, David Muñoz, Mariana Noreña
……………..……………………………………………………………………………..